Memory Leaks in JavaScript
· 15 min read Đọc bài này bằng tiếng ViệtMemory leaks are a problem every developer eventually faces. Memory leaks cause applications to run slower, crash, or affect other applications. So what are memory leaks?
A memory leak can be defined as memory that is no longer used by the application but, for some reason, hasn’t been released back to the operating system or a pool of free memory. Different programming languages have different ways of managing memory. These memory management approaches help reduce the likelihood of memory leaks. However, determining whether a piece of memory is still in use is a difficult problem. Only the developer can truly decide whether that memory should be freed. Some languages (like JavaScript) provide automatic memory management for developers; others require developers to manually free memory when it’s no longer needed.
Memory management in JS
JavaScript is one of the languages with garbage collection. Languages like JavaScript manage memory on behalf of the developer by periodically checking whether previously allocated memory can still be “reached” by other parts of the application. In other words, languages like JavaScript transform the problem from “which memory is still needed by the application” to “which memory can still be accessed by the application.” The difference between these two problems is subtle but crucial: only the developer knows what memory is still needed, but determining whether memory is reachable can be automated by an algorithm.
Memory leaks in JS
The main cause of memory leaks in garbage-collected languages is unwanted references — memory that is referenced but not actually used by the application. To understand this better, we first need to understand how garbage collectors work and how they determine whether memory is “reachable.”
Mark and sweep
Most garbage collectors use the mark-and-sweep algorithm to free memory. The algorithm consists of these steps:
- First, the garbage collector builds a list of
roots.Rootsare essentially global variables whose references are stored in code. In JavaScript,windowis such a global variable.Windowalways exists in the program, so the garbage collector considers it and all its children as always present. - All
rootsand their children are marked as active. Any memory that can be reached fromrootsis considered active and not marked as garbage. - All memory not marked as active is now considered garbage. The collector can then free this memory.
Although modern GCs have optimized this algorithm, the mechanism remains unchanged: reachable memory is considered active; everything else is considered garbage.
Unwanted references are references to memory that the developer knows is no longer needed but, for some reason, is still retained in the system. In JS, these unwanted references are variables kept somewhere in code that will never be used again but still point to memory that should be freed.
4 types of memory leaks in JS
1: Global variables
JavaScript allows declaring variables without a declaration keyword. For example:
a = 'value';
console.log(a); // "a"
When a variable is declared this way, JS automatically attaches it to the global object (window in browsers). If this variable only operates in global scope, there’s not much difference. But if it’s defined inside a function, that’s another story:
function foo() {
  bar = 'this is an implicit global variable';
}
The above code is equivalent to this in the browser:
function foo() {
  window.bar = 'this is a global variable';
}
If bar is declared within foo’s scope without using var, bar is created in global scope — a textbook example of a memory leak.
Another way to accidentally create global variables is through this:
function foo() {
  this.variable = 'could be a global variable';
}

foo();
Since this in a function points to the global root (window) when the function is called directly (not through an object), in the example above, variable gets attached to global scope.
One way to mitigate these errors is to add "use strict;" at the top of your JS file. It prevents accidental global variable declarations like the above.
Note when working with global variables
Global variables are never automatically freed by the mark-and-sweep algorithm. Therefore, global variables should only be used to temporarily store data for processing. If you need to store a large amount of data in a global variable, make sure to set it to null or reassign it when you’re done.
2: Forgotten callbacks and timers
Here’s an example of a memory leak with setInterval:
var data = getData();
setInterval(function(){
  var node = document.getElementById("Node");
  if(node){
    node.innerHTML = JSON.stringify(someResource));
  }
}, 1000);
This is an example of a hanging timer. A hanging timer is one that references nodes or data that are no longer in use. In the example above, if node is removed at some point, the entire callback code in the interval is no longer needed. However, because the interval is still active, the memory used in the callback can’t be freed (you’d need to stop the interval first). Additionally, external objects referenced by the interval callback also can’t be freed because they remain reachable through that callback. In the example above, that’s data.
Another leak-prone case involves observer objects (DOM and their event listeners). This mainly affects older browsers (e.g., IE6) because modern browsers handle this automatically. This was a bug in IE6’s GC leading to circular references.
3: References to detached DOM nodes
Sometimes you want to store DOM nodes in data structures like arrays or objects in JS code to perform various operations. For example, if you want to update data in several elements, storing them in an array makes sense. When this happens, there are two references to that DOM element: one from the DOM tree, and one from the JS array object. If you want to remove these elements, you need to remove all references to them to free the memory.
Example:
var elements = {
  button: document.getElementById('button'),
  image: document.getElementById('image'),
  text: document.getElementById('text'),
};

function doStuff() {
  image.src = 'http://some.url/image';
  button.click();
  console.log(text.innerHTML);
}

function removeButton() {
  // button is a child of body.
  document.body.removeChild(document.getElementById('button'));

  // Here, button is still referenced by elements. In other words,
  // it still resides in memory and cannot be freed.
}
Another important issue is when you reference a leaf node or inner node of a DOM tree, such as a table cell (<td> of a <table>). If you keep a reference to that <td> in JS code, then when you remove the <table> containing it, the GC cannot free the entire table — not just that <td>. Because the child node still references its parent, the GC considers the parent referenced and skips it. So be careful when keeping references to DOM nodes.
4: Closures
Closures simply mean a function inside another function’s scope that can reference variables from the outer function. Why can closures cause leaks? Look at this example:
var theThing = null;
var replaceThing = function () {
  var originalThing = theThing;
  var unused = function () {
    if (originalThing) console.log('hi');
  };
  theThing = {
    longStr: new Array(1000000).join('*'),
    someMethod: function () {
      console.log(someMessage);
    },
  };
};
setInterval(replaceThing, 1000);
This example shows that each time replaceThing is called, theThing creates a new object containing an array and a closure (someMethod). At the same time, the unused variable also holds a closure referencing originalThing (which is the theThing object created from the previous replaceThing call). Importantly, when a scope is created for closures sharing the same parent scope, they share that scope. In this example, someMethod and unused share the same scope. Even though unused is never called, because it references originalThing, the GC considers it still active. When this code runs, memory grows steadily and is immediately visible. Essentially, a linked list of closures is created (rooted at theThing), which is why memory increases over time.
Garbage Collectors
Although GCs save us from manual memory management, there are trade-offs. One is that GCs operate unpredictably. It’s usually hard to be certain whether a collection has occurred. This also means that in some cases, a program’s memory usage is higher than what it actually needs. In other cases, applications suffer from brief pauses while collection runs. Currently, most GCs only trigger collection during memory allocation. If no allocation happens, GCs remain idle. Consider these scenarios:
- The program has allocated a small amount of memory.
- Later, most (or all) elements become unreachable.
- The program stops allocating memory.
In this situation, most GCs will not run further collections. In other words, even though unreachable elements exist, they won’t be reclaimed. This isn’t strictly a leak, but it still causes memory bloat.
Chrome Memory Profiling Tools
Chrome provides a set of tools to inspect the memory usage of JS code. Two important views related to memory are: timeline and profiles.
Timeline View
Timeline View helps us see the memory usage pattern of a program. From here, we can detect memory leaks — memory usage that continuously increases over time without decreasing after each GC run.
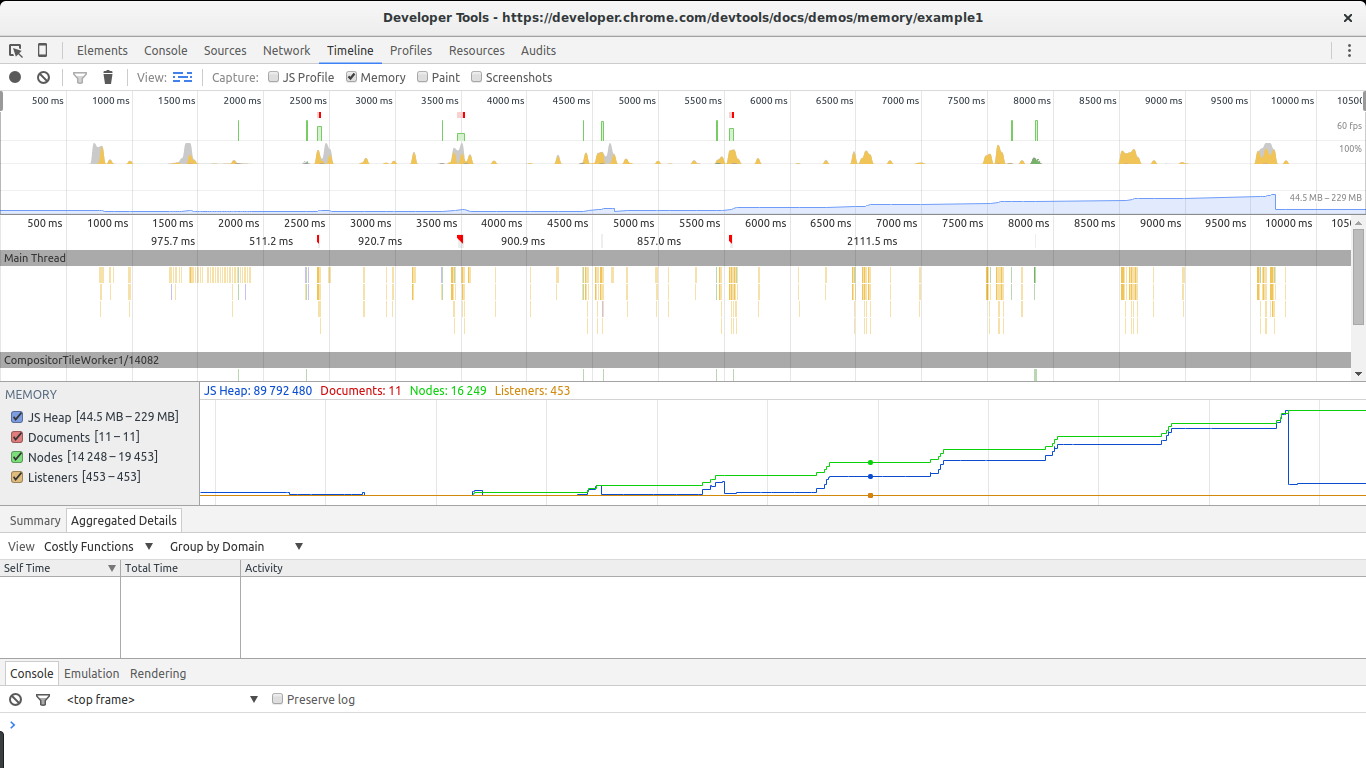
We can see the memory leak through the JS heap steadily growing over time. Even after a large collection at the end, the program still uses more memory than at the start. The Node count is also higher — a sign of DOM nodes leaking somewhere in the code.
Profiles view
This is the tool you’ll rely on when investigating memory leaks. Profiles view lets you take snapshots of a JavaScript program’s memory usage. It also lets you record memory allocations over time. Each result type provides different lists, but what you need to focus on are the summary list and the comparison list.
Summary View gives an overview of object types created and allocated, along with aggregated sizes: Shallow size (total size of all objects of a specific type) and Retained size (shallow size plus the size of objects retained by this object). It also shows the distance between an object and the root.
Comparison View provides the same information as summary view but allows comparison between different snapshots.
Example: Finding memory leaks in Chrome
There are two main types of memory leaks: leaks that cause memory to grow steadily over time, and leaks that happen once without causing further memory growth. Finding steadily-growing leaks is relatively straightforward (using timeline view). However, these are the most troublesome: if memory keeps growing, the browser will slow down and eventually the script will stop running. One-time leaks can be easily detected when memory reaches a certain size. Usually, these small one-time leaks are treated as optimization issues. But leaks that cause continuous memory growth are considered bugs and must be fixed.
Here we’ll use an example from Chrome. The full code:
var x = [];

function createSomeNodes() {
  var div,
    i = 100,
    frag = document.createDocumentFragment();
  for (; i > 0; i--) {
    div = document.createElement('div');
    div.appendChild(
      document.createTextNode(i + ' - ' + new Date().toTimeString())
    );
    frag.appendChild(div);
  }
  document.getElementById('nodes').appendChild(frag);
}
function grow() {
  x.push(new Array(1000000).join('x'));
  createSomeNodes();
  setTimeout(grow, 1000);
}
When grow is called, it starts creating div elements and appending them to the DOM. It also creates a large array (1 million elements) and pushes it into an array referenced by a global variable (x). This causes memory to grow steadily, detectable with Timeline view.
Detecting steady memory growth in Chrome
We’ll start with Chrome’s example. After opening the example, open Dev Tools, go to the timeline tab, check memory, and click the record button. Then go back to the example page and click The Button to start the memory leak. After a while, stop recording and examine the results:
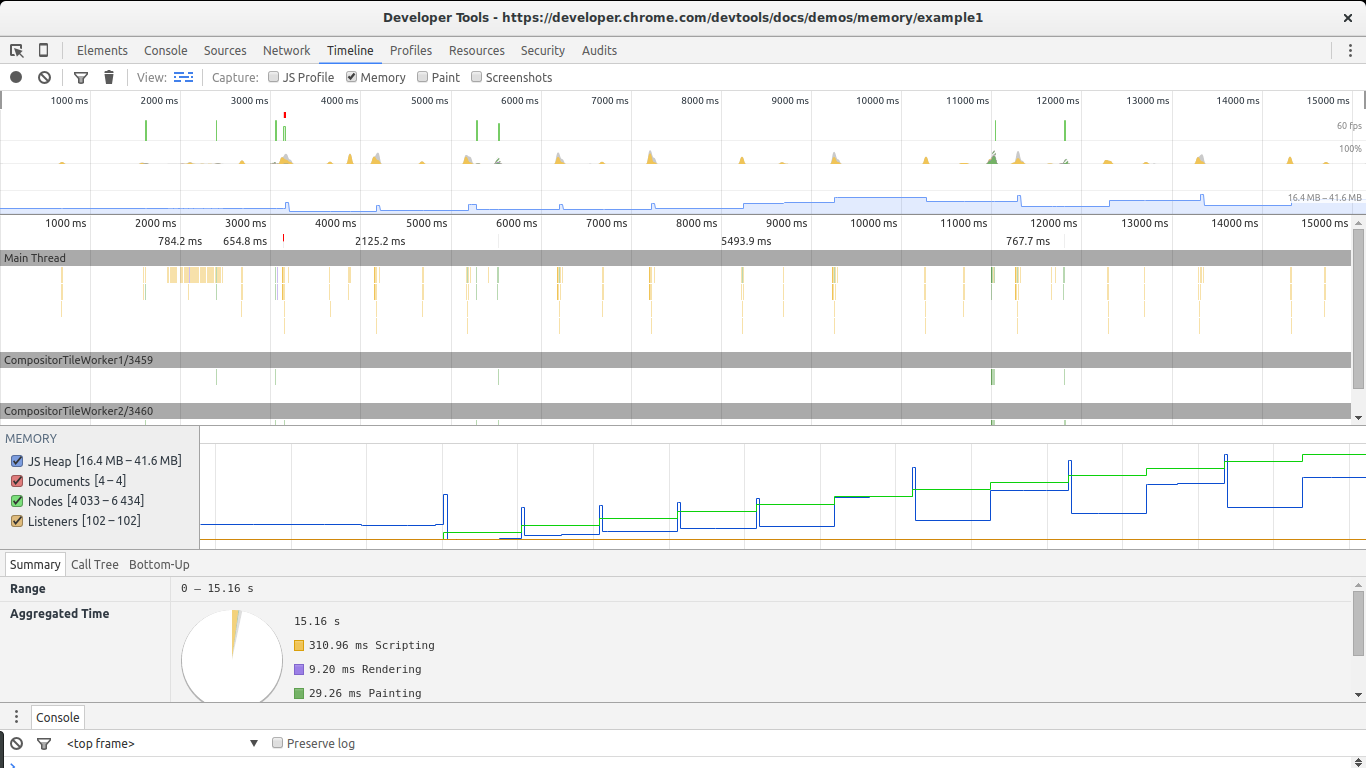
There are two major signs in the image above indicating a memory leak: the chart for nodes (green line) and the chart for JS heap (dark blue line). The node count keeps increasing and never decreases — a major warning sign.
The JS heap also grows over time, though this is harder to see due to GC effects. You can see memory go up and then down repeatedly. The key point is that after each collection, the JS heap size is still larger than after the previous collection. In other words, even though the GC successfully collected a lot of memory, some of it is leaking.
Now that we’re sure the program has a memory leak, we need to find the cause.
Creating 2 snapshots
To find the cause of the leak, we’ll use Chrome’s profiles tool — specifically the Take Heap Snapshot feature.
First, reload the page and take a snapshot right after loading. We’ll use this as the baseline. Then click The Button again, wait a few seconds, and take another snapshot. Then set a breakpoint to stop the leak.
There are two ways to compare snapshots. First, use Summary view and choose Objects allocated between Snapshot 1 and Snapshot 2 from the dropdown. Or switch from Summary to Comparison. In both cases, you’ll see a list of objects created between the two snapshots.
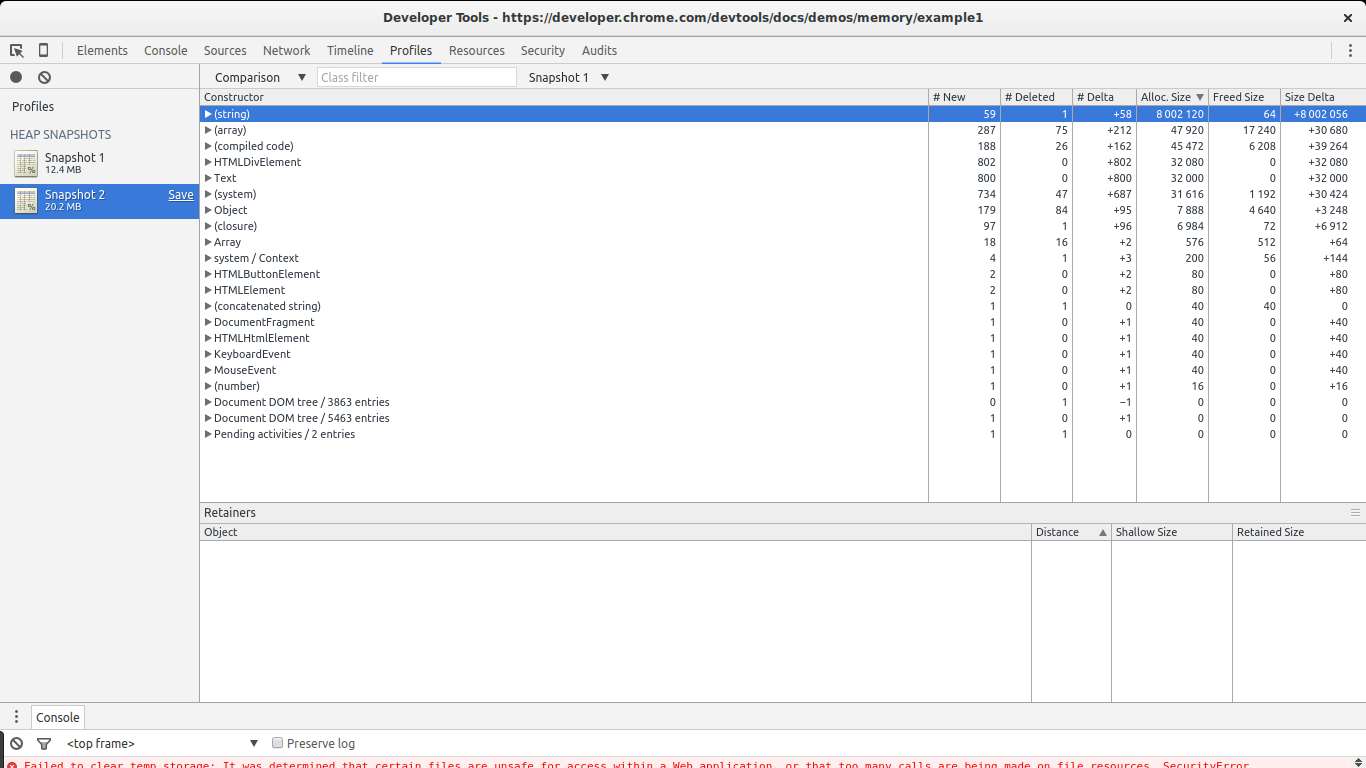
In this case, finding the leak is straightforward. Look at the Size Delta of (string). 8MB with 58 new objects. This is highly suspicious: new objects are created but not freed, and 8MB is consumed.
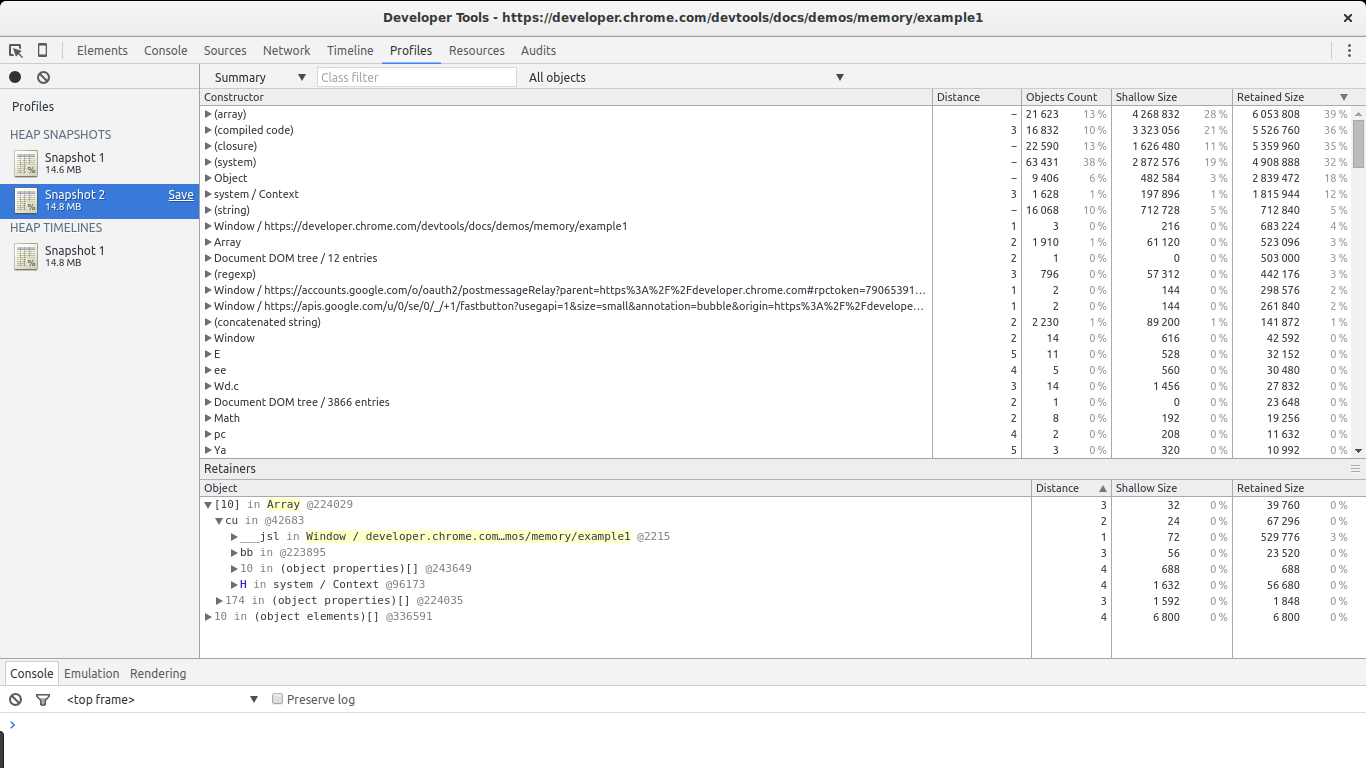
If we expand the constructor list for (string), we see some large objects alongside small ones. Selecting one of these large objects reveals interesting details in retainers:
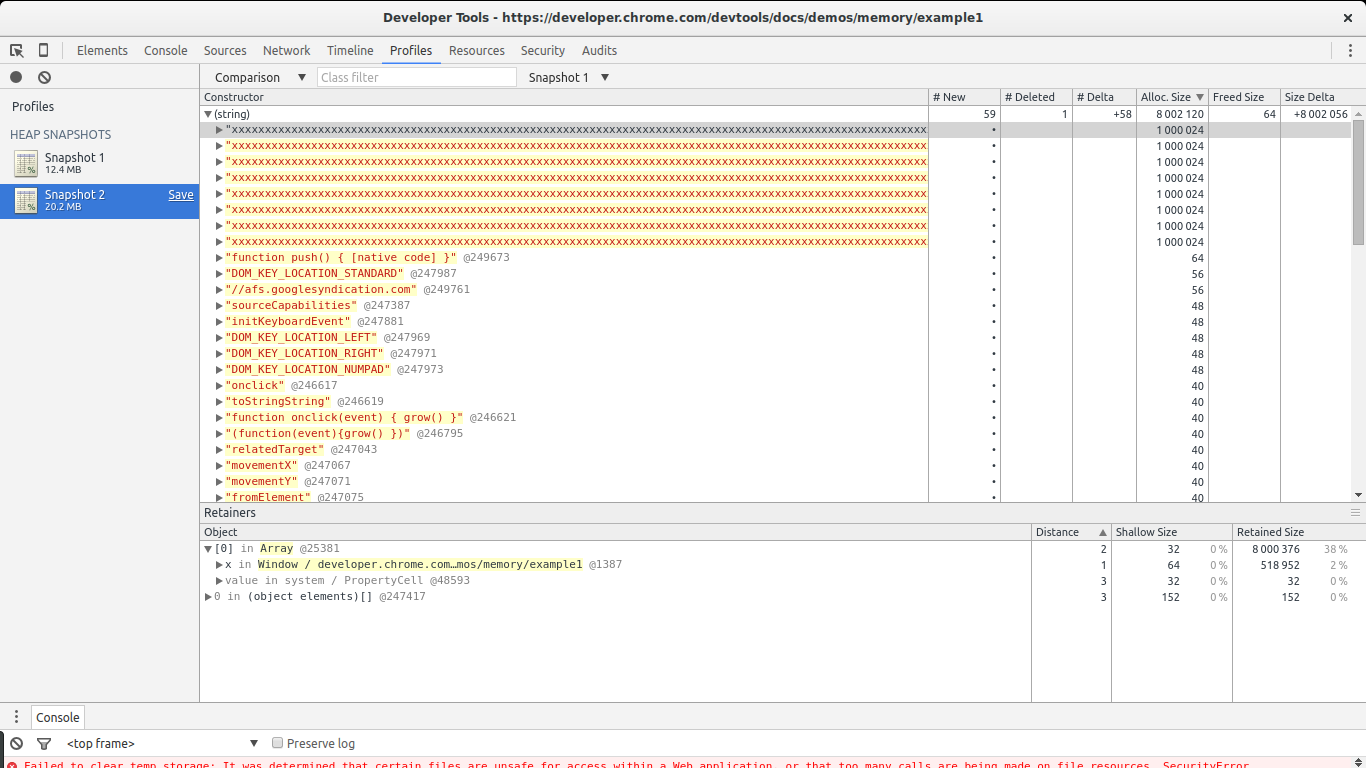
We can see the selected object is an element of an array. Then we see this array is referenced by variable x inside window. This shows the entire path from our large object to the root (window). We’ve found a cause of the leak and where it’s referenced.
Record Heap Allocations
We start by letting the script continue running and go back to the Profiles tab in Chrome Dev Tools. Click Record Heap Allocations. While the tool is running, you’ll see blue bars on the chart at the top, showing object allocation as the program runs.
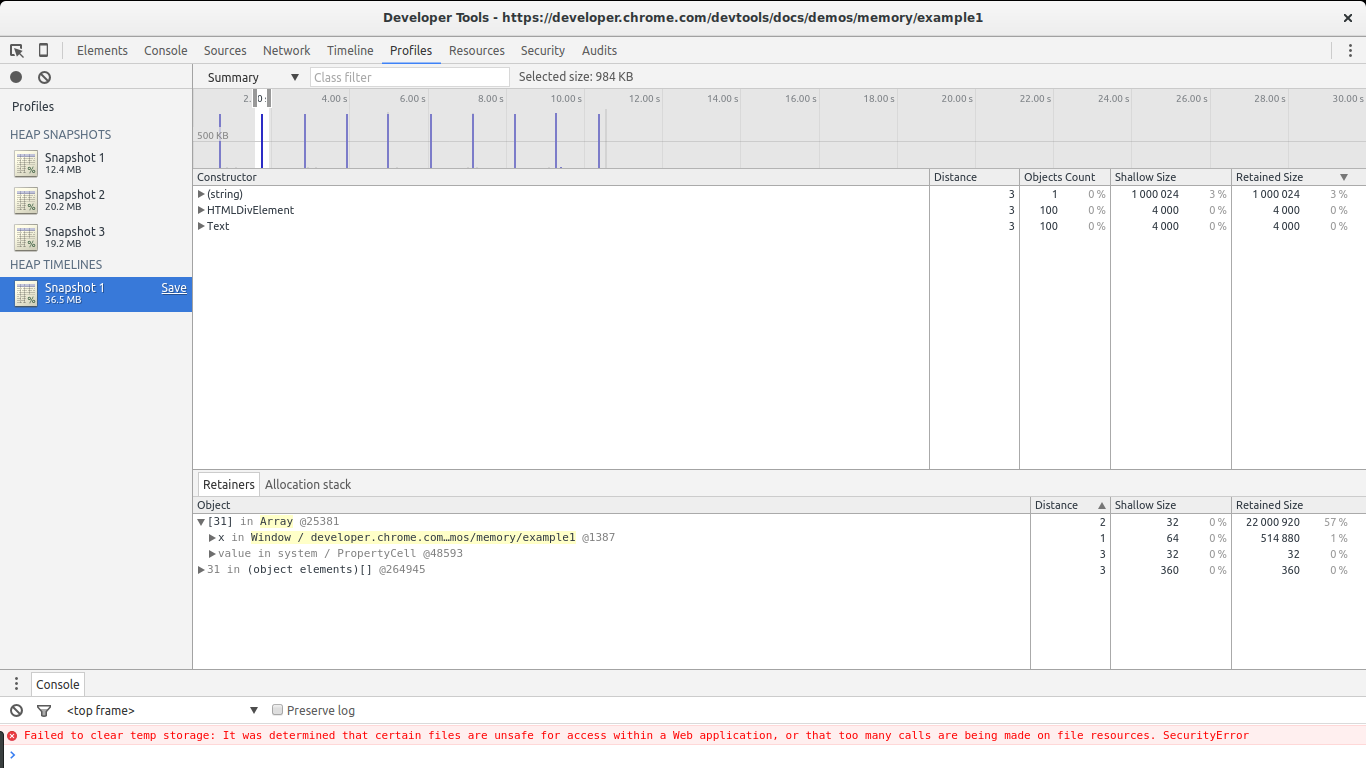
The tool’s feature: select a time range to see which objects were allocated during that period. Place the range as close to the dark blue bars as possible. Only three constructor functions are shown in the list: one related to the (string) leak above, another related to DOM creation, and the last one related to Text creation.
Select one of the HTMLDivElement constructors and choose Allocation stack.
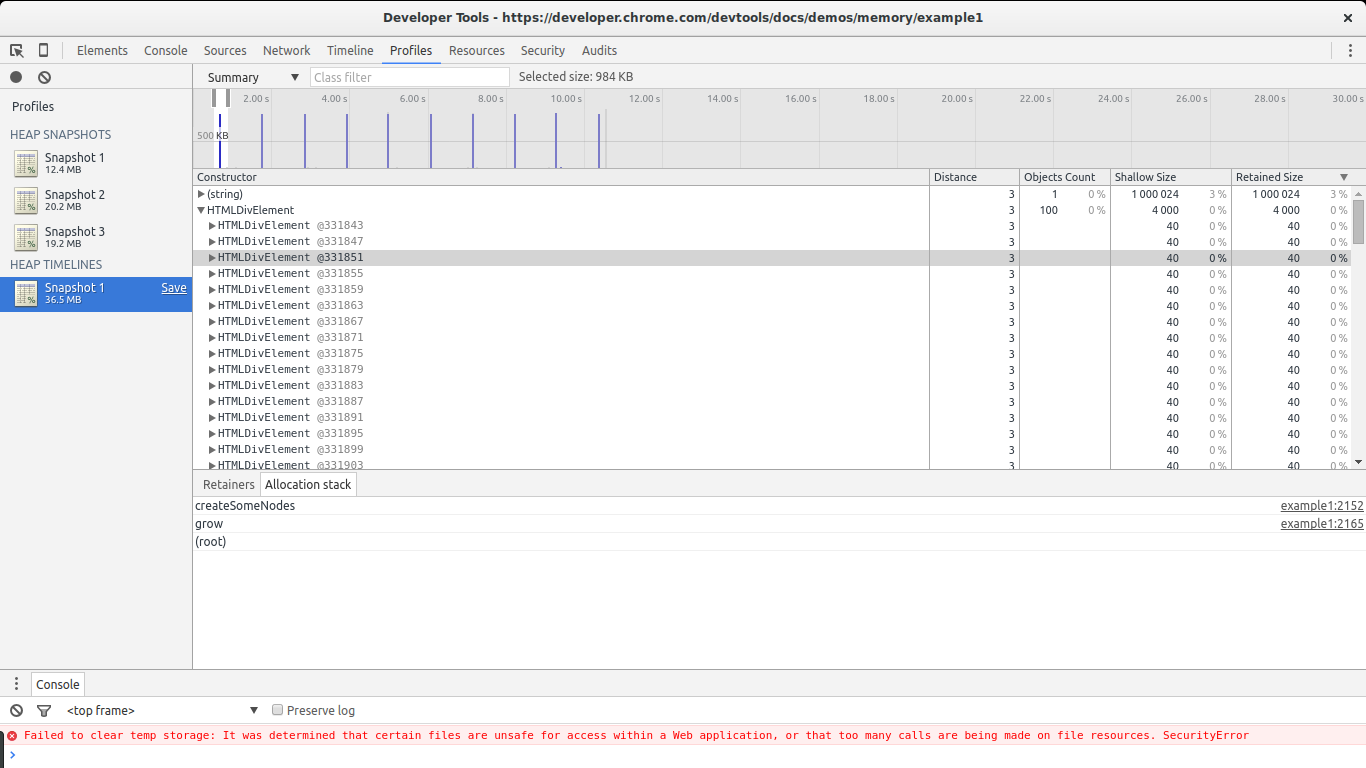
From the image above, we see the element was created by grow -> createSomeNodes. Looking closely at each bar on the chart, we see HTMLDivElement is called multiple times. Going back to the snapshot comparison view, we see it only creates objects without deleting them. Now that we know where objects are leaking (createSomeNodes), we can go back to the code and fix it.
Other useful features
Instead of using Summary view, we can use Allocation view:
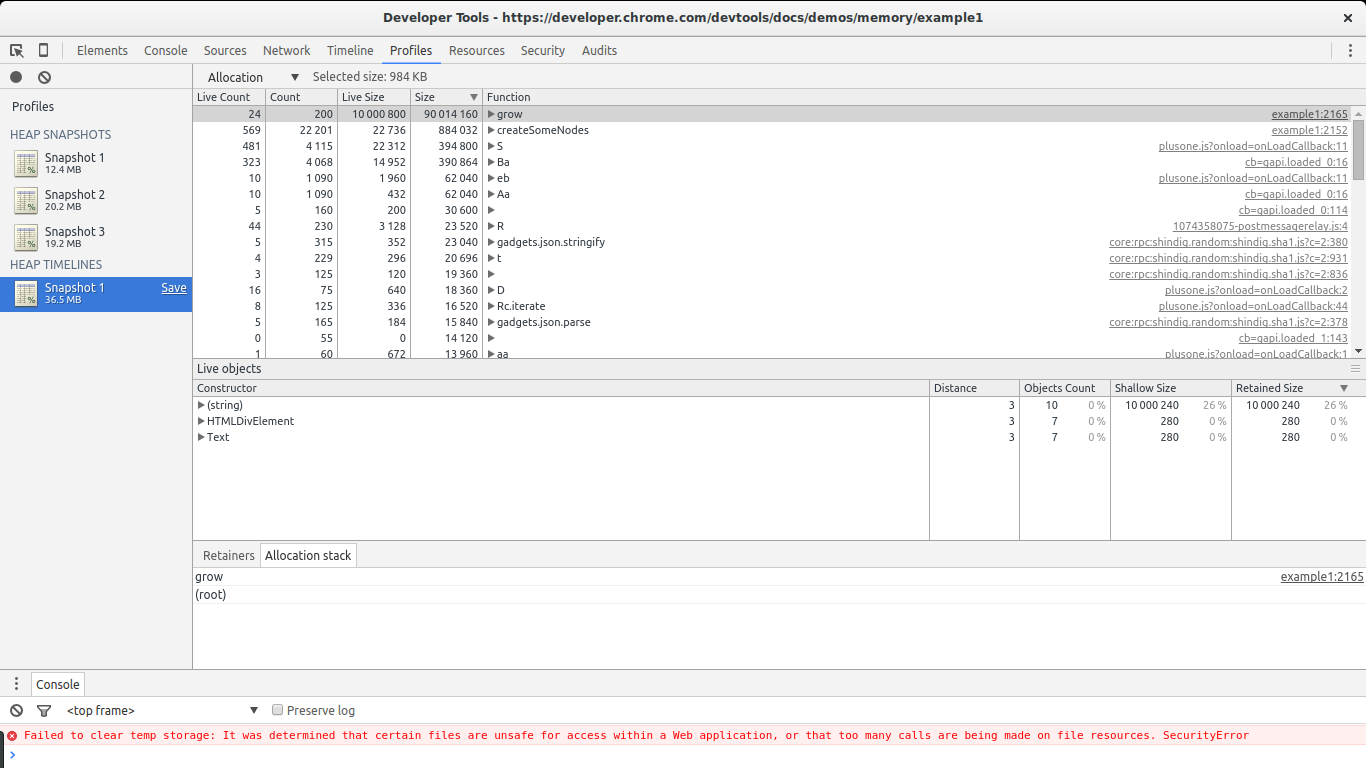
This view shows a list of functions and their associated memory allocation. We can immediately see grow and createSomeNodes stand out. Selecting grow shows the constructor objects called. Notice (string), HTMLDivElement, and Text as constructors for the leaked objects.
Note: to use this feature, go to Dev Tools -> Settings and enable record heap allocation stack traces before recording.

Comments